Model Fit and Residuals with R
A Quick Recap
| Person | 1 | 2 | 3 | 4 | 5 | 6 | 7 | 8 | 9 | 10 | 11 | 12 | 13 | 14 | 15 | 16 | 17 | 18 | 19 | 20 |
| Age | 58 | 46 | 56 | 37 | 23 | 30 | 20 | 25 | 31 | 50 | 34 | 27 | 22 | 52 | 20 | 42 | 20 | 58 | 24 | 35 |
| BP | 167 | 136 | 116 | 116 | 101 | 121 | 103 | 101 | 105 | 158 | 117 | 118 | 113 | 148 | 105 | 142 | 89 | 153 | 122 | 135 |
We’re looking at the relationship between blood pressure samples and age. For this study, we have 20 people ranging in age between 20 and 58. Our median age is 32.5; mean age is a little higher at 35.5. We also determined that the blood pressure samples are evenly distributed.
We found evidence that our linear model was underestimating blood pressure rates for older participants. There was also an individual, Person 3 (56,113), whose blood pressure was substantially lower than expected.
Model Fit
This article is all about the summary read out. Let’s take another look at the summary data for our model:
summary(m)##
## Call:
## lm(formula = BP ~ Age, data = data)
##
## Residuals:
## Min 1Q Median 3Q Max
## -34.248 -6.525 1.099 8.124 15.639
##
## Coefficients:
## Estimate Std. Error t value Pr(>|t|)
## (Intercept) 76.6333 7.9199 9.676 1.48e-08 ***
## Age 1.3146 0.2091 6.288 6.28e-06 ***
## ---
## Signif. codes: 0 '***' 0.001 '**' 0.01 '*' 0.05 '.' 0.1 ' ' 1
##
## Residual standard error: 12.36 on 18 degrees of freedom
## Multiple R-squared: 0.6872, Adjusted R-squared: 0.6698
## F-statistic: 39.54 on 1 and 18 DF, p-value: 6.284e-06R modeling stores a handful of features with the saved variable, these can be accessed by calling names(m). We used the coefficients in the last article, now we’ll take a look at attributes that give us a better look at how well our model fits the data.
names(m)## [1] "coefficients" "residuals" "effects" "rank"
## [5] "fitted.values" "assign" "qr" "df.residual"
## [9] "xlevels" "call" "terms" "model"Residuals
Our residuals, or differences between the estimated and actual blood pressure measurements, range from an overestimate of 34.2 mmHg, to an underestimate of 15.6 mmHg. The median residual is 1.1mmHg, a slight underestimate. We can determine which residuals belong to a sample by calling resid(m), the equivalent of m$residuals. Our min and max residuals belong to Person 3 and Person 10, respectively.
| 1 | 2 | 3 | 4 | 5 | 6 | 7 | 8 | 9 | 10 | 11 | 12 | 13 | 14 | 15 | 16 | 17 | 18 | 19 | 20 |
|---|---|---|---|---|---|---|---|---|---|---|---|---|---|---|---|---|---|---|---|
| 14.12 | -1.1 | -34.25 | -9.27 | -5.87 | 4.93 | 0.08 | -8.5 | -12.38 | 15.64 | -4.33 | 5.87 | 7.45 | 3.01 | 2.08 | 10.16 | -13.92 | 0.12 | 13.82 | 12.36 |
These values may be difficult to read on their own, so I’ll add them back to our dataframe and visualize.
data$Predicted <- predict(m)
data$Residuals <- resid(m)
We can now match up the residuals in the table above with the estimates in the figure below. For the figure below, black dots are the actual values, while the black rings along the regression line are the estimated values given the subject’s age. Person 3 and Person 10 are not well estimated, while Person 2, 7, 14, and 18 have a much smaller residual error.
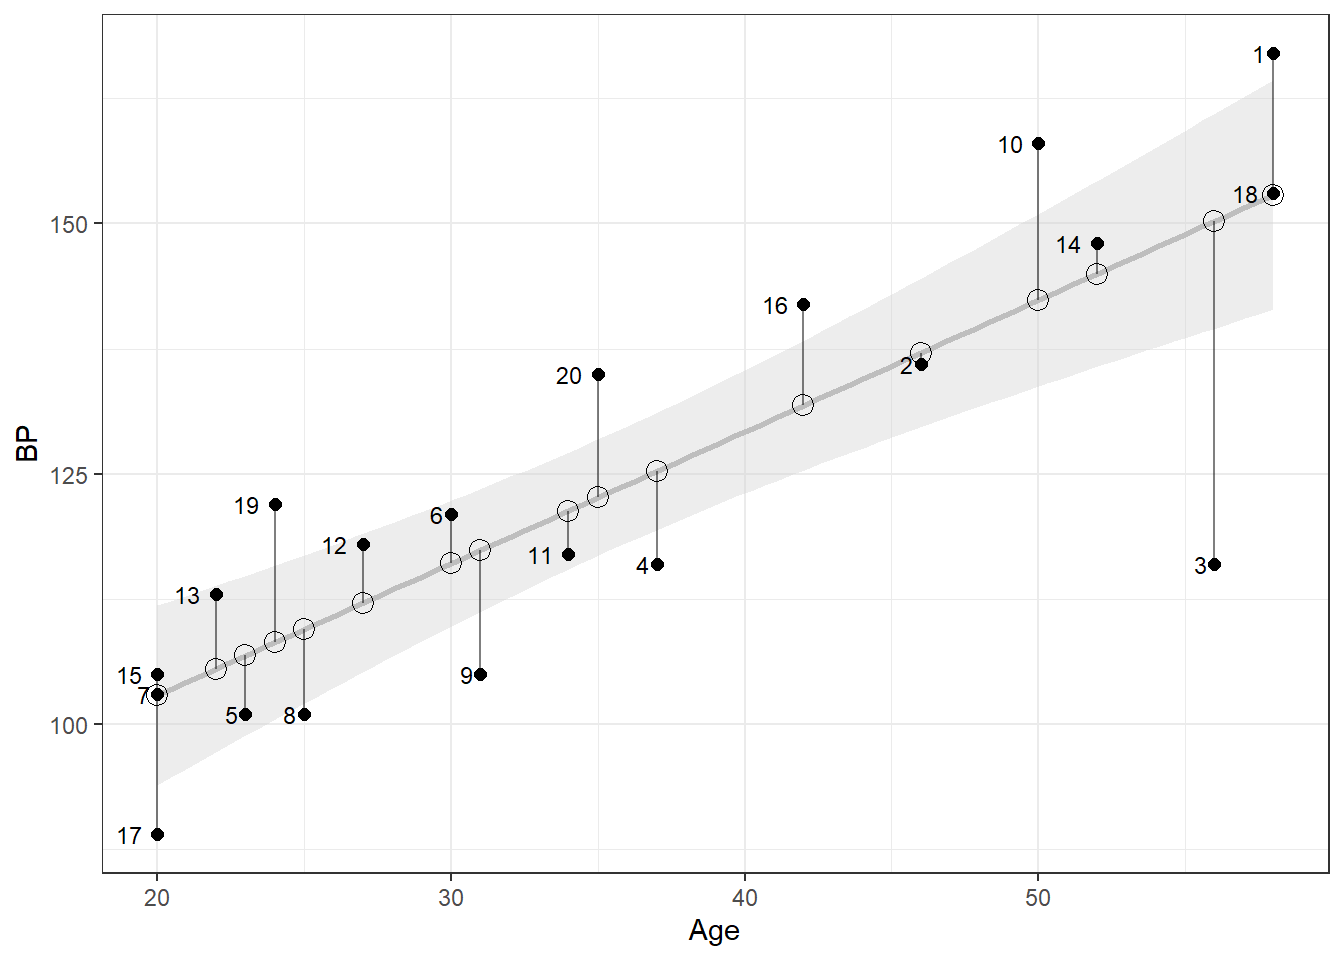
Figure 1: Residuals: Over- and Underestimates of Blood Pressure
Residual Standard Error (RSE)
The RSE is a standard deviation estimate for linear regression. Smaller values tend to mean a better fit, while an RSE of zero (our estimates perfectly predict our values) would certainly mean our model has been overfit.
\[RSE = \sqrt{SSE/df_R}\]
The residual standard error is the square root value of the sum of squared errors (SSE) divided by the residual degrees of freedom (df). Squaring residuals eliminates the sign (\(\pm\), for an over- or underfit). Taking the mean of residuals otherwise would simply give us a value at or near zero as over- and underestimates cancel each other out. Given 20 samples and 1 parameter (Age), we’ll calculate the degrees of freedom using \(df_R = n - p - 1\) or \(df_R = 20 - 1 - 1 = 18\).
SSE <- sum(resid(m)^2)                             # 2751.189
df <- length(m$residuals) - length(m$coefficients) # 18

RSE <- sqrt(SSE/df)   #12.363
Multiple R-squared
Multiple R-Squared and the Adjusted R-squared focus on correlation in our model. Correlation can range from -1 to 1, with values closer to -1 or 1 resulting in high correlation. For our data, we have a correlation value of 0.829 (cor(Age,BP)) which gives us a multiple R-squared value of 0.687. Adjusted R-squared values are calculated to account for increased variance with multiple parameters and tend to be more conservative. As such, Adjusted R-squared values are particularly useful for models with several parameters.
cor(data$Age, data$BP)^2 # 0.687F-statistics
Linear modeling in R uses t-testing and F-statistics to determine if any coefficients significantly influence our dependent variable. In our case, we are testing out whether Age influences BP. In short, a p-value < 0.05 would tell us that Age is a significant coefficient at \(\alpha = 0.05\). In our case, we can see that the p-value for Age is < 0.001; there is a relationship between age and blood pressure.
pvals <- summary(m)$coefficients[,4] # 6.28e-06 In Summary
The summary() feature provides critical feedback about the relationship between our dependent variable, BP and our coefficient or independent variable, Age. While not perfect, we have a relatively good model for predicting blood pressure.
The next post will look at how to improve our model fit. We’ll use R’s built in diagostics to determine the impact of outliers, sample size, and variance within the data.